Tuesday, August 4, 2009


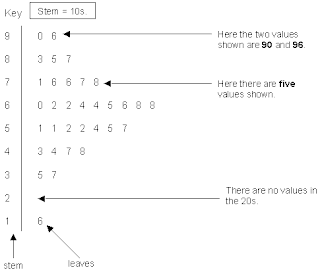
A stem in leaf plot is an easy way to group numbers together and cut down on alot of time and space. This graph shows and tells you exactly how a stem and leaf plt works. You basically put the first number on the outside and the sec numbers on the inside of the line.

http://www.uow.edu.au/student/attributes/statlit/modules/images/2_31.gif

Box ploting is a good way to group numerical values together and through 5 different summaries. It calculates the minumum, maximum, median, and quartile 1 and 3.

Histgrams are used to compare alot of different data and show the variation of a certain variable. This graph shows the average score of the test and the number of students that received those grades.

http://media.techtarget.com/digitalguide/images/Misc/iw_histogram.gif
Parallel Coordinate System is used predominantly in baseball statistics where you are able to show a varies number of stats and being able used in one plot.

http://www.matthewtavares.com/baseball_report/

A triangular plot shows 3 variables and compares this accordingly to their color. This triangular plot has 3 variables and a color sceme of 7 different colors to show the differences.

http://www.pmel.noaa.gov/maillists/tmap/ferret_users/fu_2007/jpgCqrZqdDwYG.jpg
A windrose graph shows the amount and the percentage of wind change is all different directions. You can measure any direction needed to know the wind changes.

http://www.vistadatavision.com/uploads/images/reports/wind_rose_vector_1.png
A climograph shows the climate changes from month to month in the given area. This graph shows the precipiation and the temperature changes on a month to month basis.

http://www.uwsp.edu/geo/faculty/ritter/images/atmosphere/climate/climographs/memphis.jpg